Hubble diagram for Cepheids

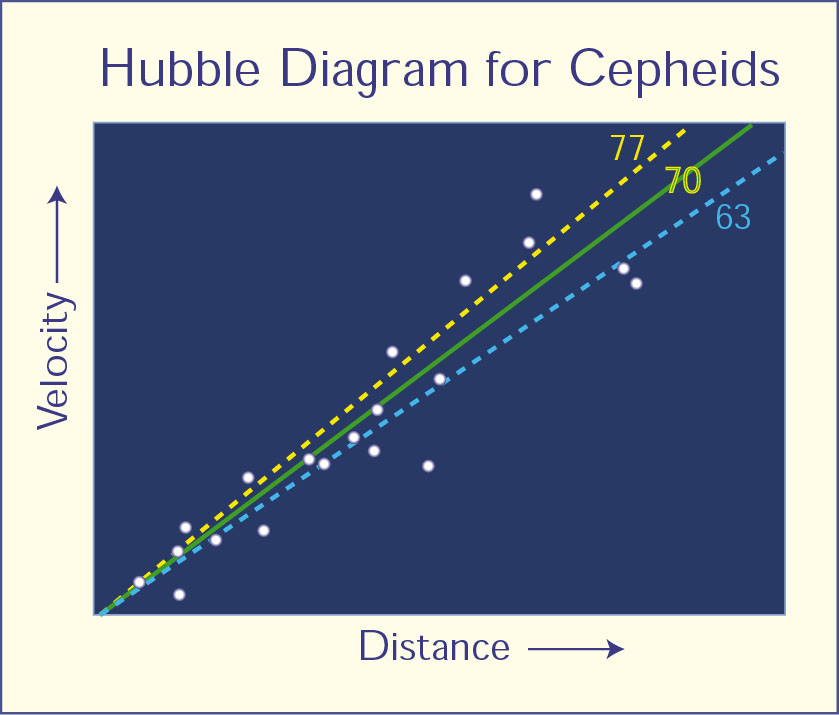
Hubble Diagram for Cepheids This is a plot of galaxy distance versus the velocity that the galaxy appears to be receding from Earth. It is based on data collected by the Hubble Space Telescope Key Project team. The distances have been measured using Cepheid variables. The slope in the plot measures the expansion rate of the universe, a quantity called the Hubble constant. The best fit to the data yields a Hubble constant of 70 kilometers/second/megaparsec. The dashed lines indicate Hubble constant values of 77 and 63 and do not fit the data as well. This plot is analogous to that obtained by Carnegie astronomer Edwin Hubble that led to his discovery of the expansion of the universe. With the Hubble Space Telescope, it is now possible to measure Cepheid distances over 30 times farther away than Hubble was able to do.
Credit:NASA & ESA
About the Image
About the Object
| Name: | Cepheids |
| Type: | Unspecified : Star : Type : Variable |
| Category: | Illustrations |