Light curve of Cepheid variable star V1
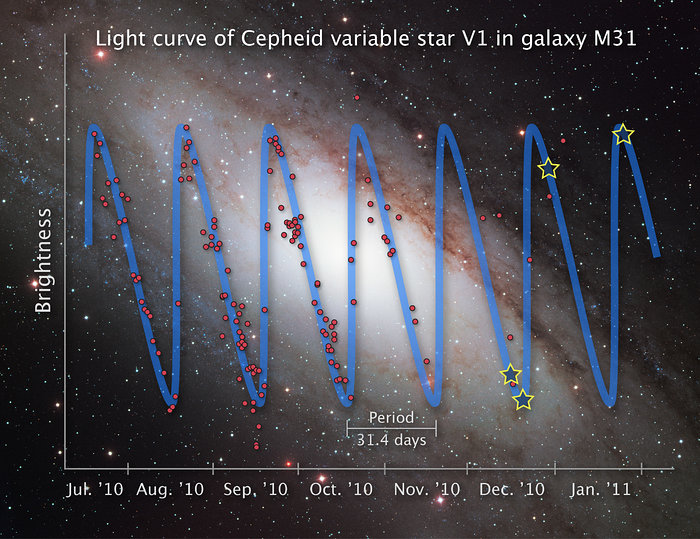
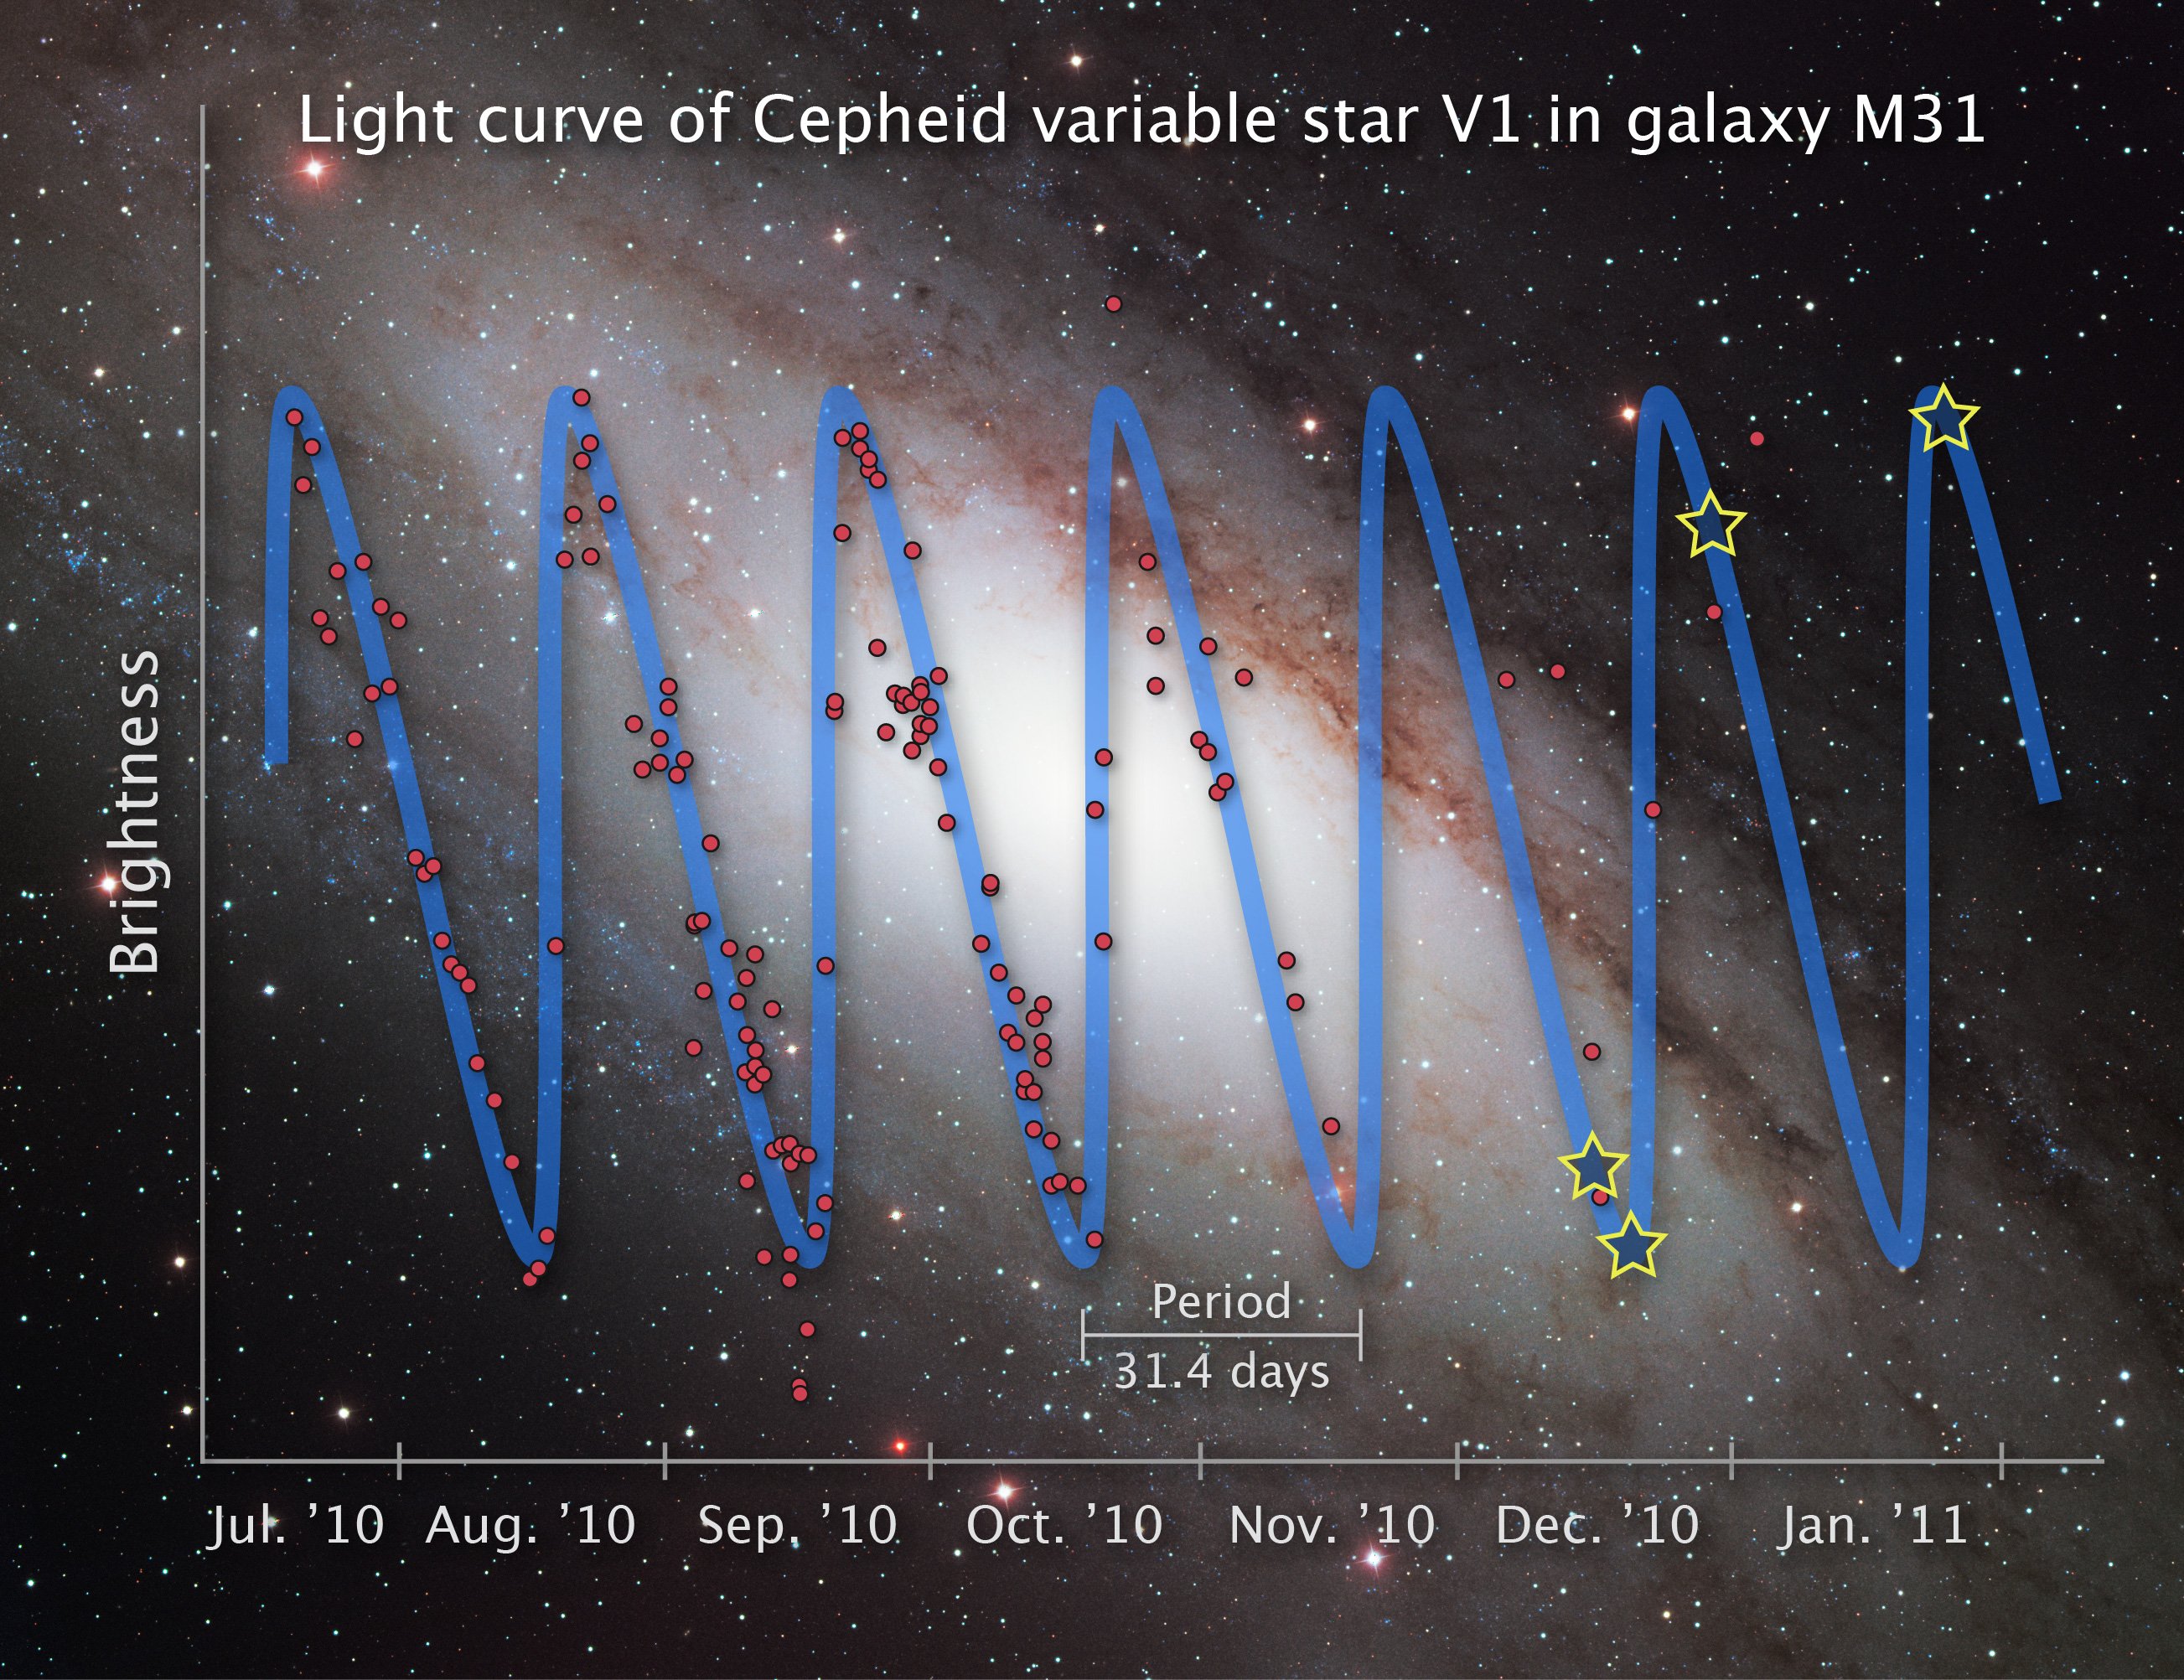
This illustration shows the rhythmic rise and fall of starlight from the Cepheid variable star V1 over a seven-month period.
Cepheid variables are pulsating stars that brighten and fade in a predictable pattern. The illustrated graph shows that V1 completes a pulsation cycle every 31.4 days. The red dots on the graph represent observations by the American Association of Variable Star Observers (AAVSO), who partnered with the Space Telescope Science Institute's Hubble Heritage Project to study the star. The four stars on the graph denote observations made by the Hubble Space Telescope's Wide Field Camera 3.
Ten amateur astronomers from around the world made 214 observations of V1 between July 2010 and December 2010, obtaining four pulsation cycles. The AAVSO study allowed the Hubble Heritage team to target Hubble observations that would capture the star at its brightest and dimmest phases.
Credit:About the Image
| Id: | opo1115e |
| Type: | Collage |
| Release date: | 23 May 2011, 20:00 |
| Related announcements: | ann1110 |
| Size: | 2606 x 2005 px |
About the Object
| Name: | Andromeda Galaxy, Hubble's Cepheid, V1 |
| Type: | Local Universe : Star : Type : Variable Local Universe : Galaxy : Type : Spiral |
| Distance: | 2 million light years |
| Category: | Galaxies Stars |